The Graph Looked Better Than the Work
A falling line, a missing group of images, and the afternoon I started putting counts beside percentages.
 John Le · Jun 22, 2025 · 10 min read

The line went down for six consecutive days. I had used a quiet blue, removed the heavy grid and given the chart a title that implied progress. By the time I carried the laptop into the meeting, I had started believing that progress myself.
We were checking a small image-processing pipeline. The plotted number was an error rate. Lower was better, and the latest point was the lowest. A colleague asked how many difficult night photographs had arrived that week. I opened another table, expecting to answer quickly.
The answer took most of the afternoon. Fewer night photographs had arrived, and some that had failed an earlier processing step weren't included in the chart at all. The line was accurate for the records I had selected. My explanation of the line was much less accurate.
At home that evening, I watched my six-month-old daughter drop a soft toy from her chair. I picked it up three times. My wife asked how my meeting had gone. I told her I had made a very clear picture of a question I hadn't asked carefully enough.
The number underneath the line
The chart began with a reasonable request. We wanted to know whether a recent change had reduced errors. I had daily results, a date column and a field indicating whether the final output was accepted. Producing a daily percentage took only a few lines.
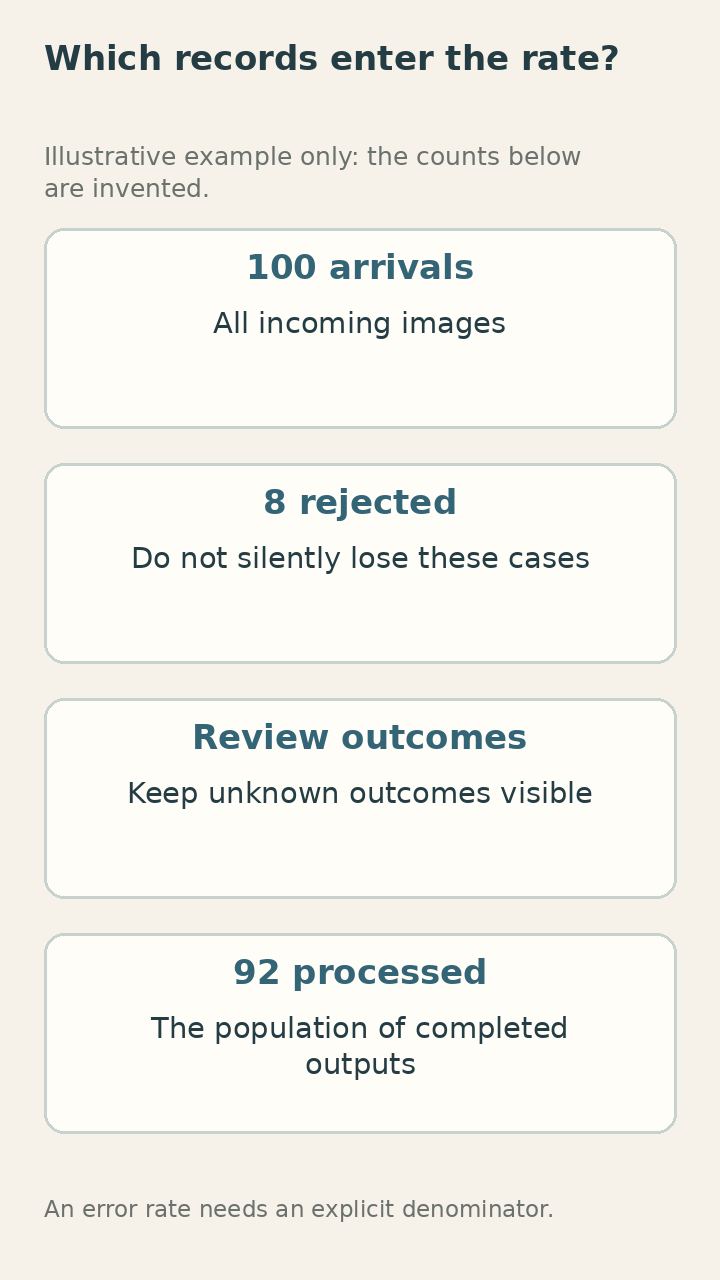
The denominator deserved more attention than those few lines received. I counted records that had reached the final stage. Images rejected earlier because they couldn't be decoded or didn't match the expected format were absent. From the chart alone, a viewer couldn't tell whether the system was improving or simply seeing an easier surviving subset.
I had not intentionally hidden those records. I had inherited a table whose rows represented completed runs and treated it as a table of arrivals. The names were close enough to make the mistake feel natural. That was a poor defence once someone asked what the percentage actually described.
We drew the process on a whiteboard. An arriving image could fail several checks before it produced an output. For each point where something could disappear, we asked whether the disappearance remained visible in the reporting. Two did. One didn't.
I added counts for arrivals and for each later stage. The resulting page was less elegant. It also let us see the difference between a rejected input and an incorrect accepted result. We could discuss both without letting one quietly leave the denominator.
The first version of my chart had said error rate. The revised title named the population. It was longer, but it stopped making a promise the underlying table couldn't support. I had spent time choosing a pleasant colour while leaving the most consequential phrase vague.
An easier Tuesday
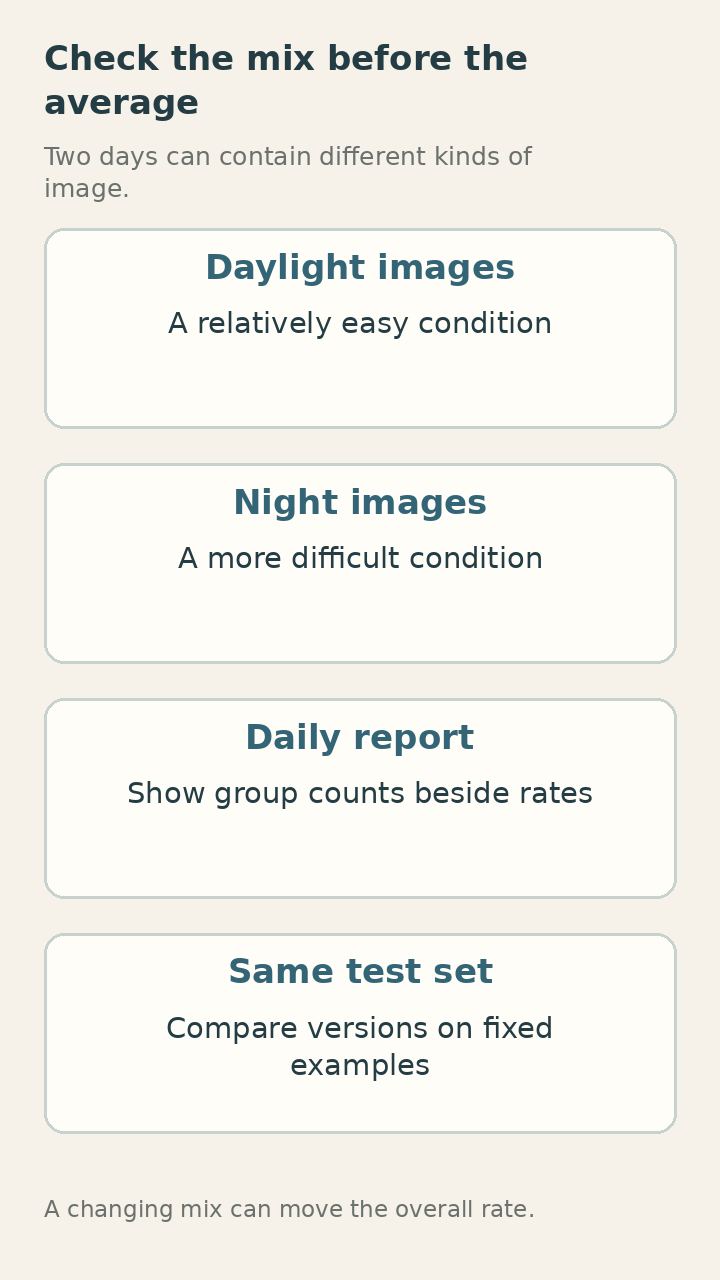
The next problem was the changing mix of images. Daytime examples were easier for the current system than night examples. If Tuesday contained more daylight work, the overall percentage could improve even without any change to the model.
I split the results by a small set of conditions we could actually identify. The groups were imperfect, and I wrote down how we assigned them. I didn't want an attractive breakdown whose categories depended on guesses nobody could reproduce.
Within some groups, the improvement was small. In another, there wasn't enough data to say much at all. The broad downward line had compressed these differences into a story that was much more decisive than the evidence.
We compared the old and new versions on the same held-out examples. That didn't answer every operational question, but it gave us a cleaner way to examine the software change itself. The daily report still mattered for describing what had happened in use. Those two comparisons served different purposes.
A colleague pointed out that one important difficult condition was rare. Its small share of the total made it nearly invisible in the overall metric. That didn't make it unimportant to the person who would have to handle a mistake when it occurred.
We put the group counts beside their rates. An impressive percentage based on four cases looked different when the number four sat in the next column. I avoided adding decimal places that suggested a level of precision our small groups didn't have.
How many examples is that sentence standing on?
I wrote the question in my notebook. It was a useful interruption whenever I began describing a small numerical change as if it were an established fact. I still needed to make decisions with limited evidence. I wanted those decisions to carry an honest description of the limit.
The axis I had cropped
I have used truncated vertical axes when looking closely at changes. They can be useful. In this case, I had cropped the range because the movement looked flat otherwise. I hadn't thought enough about how the resulting image would be read during a quick meeting.
A small change occupied most of the chart's height. The shape encouraged the eye to treat it as dramatic. The labels were present, so a careful reader could recover the scale. But the point of a chart is partly to communicate before someone reads every label. I was relying on the labels to correct an impression the picture had created.
I made two views. One showed the full relevant range. Another showed the narrow range with a clear label explaining it. Side by side, they allowed a discussion of both the absolute level and the smaller change. The second chart no longer had to pretend to be the whole picture.
I also stopped smoothing the line for this report. The smoothed version looked reassuring, but the daily counts varied and the curve made a short sequence seem more settled than it was. Points with simple connecting segments were less graceful and easier to question.
Reading the NIST engineering statistics handbook reminded me how much basic exploratory work I had skipped. Before treating a summary as the result, I needed to inspect distributions and unusual observations. These were familiar ideas. Familiarity hadn't guaranteed that I used them on a rushed afternoon.
I opened individual records around one unexpected dip. A change in a file naming convention had affected part of the processing. The chart had shown a numerical event. Looking at the records explained the event. I needed both levels rather than expecting a plotting function to do the investigation.
The examples outside the average
One mistake remained memorable because the system was confidently wrong on a clear-looking image. It didn't resemble the blurred examples we usually discussed. A reflection created a shape that the model interpreted as a character, and the resulting output looked plausible.
That example was uncommon, so it barely affected the overall rate. It mattered because a plausible wrong answer could pass through a hurried human check more easily than an obviously broken one. Counting every error as interchangeable had hidden a practical difference.
We made a small error collection with source images, expected outcomes and short notes. I kept it separate from the examples used to make repeated development choices. Otherwise it would gradually become another familiar set whose apparent success overstated generalisation.
The collection helped people outside the modelling work join the conversation. Someone who didn't want to discuss metrics could still look at an image and explain what they would do with the output. That explanation sometimes changed how we defined a useful result.
A correct answer delivered too late was another case our original chart didn't describe. So was a system that asked for review so often that the reviewer couldn't keep up. I added operational measures carefully rather than trying to fold every concern into a single score.
There was pressure to keep the report short. I understood it. A wall of numbers can make understanding harder, not easier. We settled on a small main view with clear definitions and a few examples below. Details remained available without requiring everyone to read them before asking a sensible question.
At home, I tried to explain the chart problem to my wife while washing bottles. She asked whether I could just show the bad photographs. I said we also needed to know how often they happened. She said then show both. The bottle brush was in my hand, and I had no good argument against that arrangement.
A report I could reproduce
The revised report began with a date range, an input definition and the version being checked. I stored the query used to produce the counts. If someone asked about a point, I wanted to recreate it without remembering which notebook cell I had run last.
I kept the raw records unchanged and made transformations explicit. Earlier I had corrected a category by hand in a temporary table, then forgotten to explain the correction. The next run restored the old category and produced a small difference that looked like a new finding.
There were useful checks that didn't require statistical sophistication. Did the grouped counts add up to the total? Were there duplicate identifiers? Did timestamps cross a day boundary differently in two parts of the report? A simple timezone mismatch can produce a surprisingly persuasive daily story.
I compared the total arrivals with the independent source count. When they differed, I treated the mismatch as something to resolve before discussing improvement. This made the process slower on the first few days and much less confusing afterwards.
I also wrote a short paragraph describing what the report couldn't establish. It couldn't prove that one software change caused every movement in live data. It couldn't make a rare condition well understood when we had almost no examples. These limits belonged close to the conclusions, where someone might actually read them.
The paragraph wasn't an excuse to avoid deciding. We still had to choose whether to keep the change and what to investigate next. The clearer report made that choice more concrete: retain the improvement on the fixed comparison set, monitor the difficult group, and examine the reflection failure separately.
That was a less triumphant meeting than the one I had expected to have. It produced a much more useful afternoon of work.

The chart on my own phone
A few days later I checked a personal activity graph on my phone and caught myself making the same mistake. A rising weekly line seemed to describe a better routine. Then I remembered a long walk I had taken because I had missed a turn while carrying groceries.
The measurement wasn't wrong. My quick story about it was incomplete. I didn't need a formal evaluation framework for groceries, but the experience was a good reminder that I wasn't immune to a neat picture simply because I knew how to make one.
At work I now begin a chart by writing a plain sentence about what each point represents. If that sentence becomes tangled, I usually need to inspect the data before changing the visual design. It is cheaper to discover a vague denominator before the meeting than during it.
I still enjoy a clear graph. The corrected report is easier to read than the first one in several ways. It has fewer decorative elements and more useful labels. The counts take up space, and I no longer resent them for interrupting the shape.
This morning my daughter dropped the same toy twice before breakfast. I picked it up twice. My wife moved it farther back on the tray, and it stayed there for a while. I didn't record the success rate. I was busy finding the spoon that had fallen underneath the chair.
— John
Written on Jun 22, 2025 · Hanoi
John Le · I work with AI and data in Hanoi and write here for friends.
Keep reading

The Boring Parts Became the Job: Data Science in 2026, From My Desk
Delivery photos, a Vietnamese chatbot evaluation set, and the parts of data science I used to hurry through. Notes from my desk in Hanoi.

The Model Hadn't Changed, but the Camera Had
A quiet decline in a familiar vision system, traced through a shifted camera, new labels and one useful photograph of an empty room.

A Year with a Coding Agent
A container-number reader, a reassuring test report, and the afternoon I stopped letting green ticks stand in for understanding the code.